
Behavioral Cloning
After tackling the lane line detection and the traffic sign classification projects from Udacity, the third project to be tackled was another completely different project in terms of what it achieves. The project was centered around the concept of Behavior cloning which meant that we teach a Neural Network model to do a certain task by showing it how it is to be done. The concept is very similar to how you teach babies or even adults in some cases to do certain things.
The theme of this project was to train a car to drive by itself autonomously. Udacity provided a simulator built in Unity for this purpose. The simulator has two tracks and has two modes it could work on.
Simulator Modes
- Training Mode: In the training mode the car has to be manually driven and the driving data was stored.
- Autonomous Mode: In the Autonomous mode, a Flask server was run which would use a socket connection to the simulator and then pass in the steering angles and the throttle values to the simulator. The Steering Angles are predicted whereas the throttle values are calculated with a Simple PI Controller.
Tracks
Track 1
This track was supposed to be both the training and the testing track. This meant that initially we were supposed to drive the car around on this track like its a game. Once the data is saved for this, this is passed on to a Neural Network to predict the steering angles. The goal was to make the car drive around on this track without going offroad.
Salient Features
- Track was Flat
- Favored Left Turns more than Right turns and had a lot of straight road driving.
- Has a Bridge & Rocks
- Has an evening kind of lighting
Track 2
This was meant to be a challenge track and this was much different than Track 1. This was the challenge track and the idea for this was that once the car was trained on track 1 then how it behaved on Track 2.
Salient Features
- Track has many up’s and down’s like a roller coaster.
- High speed Driving is much tougher on this than Track 1 because of up’s and down’s.
- Sharp turns present while going up and down.
- Obstacles on side of road are new as compared to Track 1
- Has a center line divide which is absent on Track 1
Data Format from Training
While training the simulator, it asks for a location to save the data. The way the data is stored is like this. There is a driving_log.csv which gets generated and an IMGS folder. The IMGS folder stores the per frame image from the driving. The way the csv is organized is shown below.
| center image | left_image | right image | steering_angle | throttle | brake | speed |
|---|---|---|---|---|---|---|
| IMG/center_2016_12_01_13_30_48_287.jpg | IMG/left_2016_12_01_13_30_48_287.jpg | IMG/right_2016_12_01_3_30_48_287.jpg | 0 | 0 | 0 | 22.14829 |
Data Exploration
Sample Data from Udacity
Udacity provided sample data for people to train their network on. This consisted primarily of driving on Track 1. This is how the data looks when loaded.
| steering_angle | throttle | brake | speed | |
|---|---|---|---|---|
| count | 8036.000000 | 8036.000000 | 8036.000000 | 8036.000000 |
| mean | 0.004070 | 0.869660 | 0.001970 | 28.169839 |
| std | 0.128840 | 0.301326 | 0.036565 | 6.149327 |
| min | -0.942695 | 0.000000 | 0.000000 | 0.502490 |
| 25% | 0.000000 | 0.985533 | 0.000000 | 30.183093 |
| 50% | 0.000000 | 0.985533 | 0.000000 | 30.186400 |
| 75% | 0.000000 | 0.985533 | 0.000000 | 30.186640 |
| max | 1.000000 | 0.985533 | 1.000000 | 30.709360 |

Training Data from Manual Training

The image above shows the training data which is generated from the simulator. All the 3 images from the left, right and center are shown here.
Dataset Augmentation
Data Augmentation is a big part of the experiments we carry out with this project. Although, gathering training data is not very difficult with the simulator, still driving around laps after laps on the simulator can become cumbersome.
I realized early on that even though the 0 steering angle had a major predominance in this training data yet throwing it away wasn’t necessary. So the techniques I tried are listed below.
- Flip the center image & the steering angle
- Generate about 20 times the data by changing brightness of all center, left & right images for steering angles less than -0.025 and greater than 0.025.
Since this would have been a lot of data all the augmentation was done while the network was running. I used Pandas DataFrames to generate augmentation by storing columns with the augmentation techniques and during training these were read and the techniques applied appropriately.
For track 1, I decided against using explicit recovery images. My goal was to get the car to drive and recover without explicitly training on those images. Although this approach worked fine for track 1, this approach didn’t work for track 2. Specifically for track 2 the car had a lot of trouble with the long bars. It would go and hit the road.
I drove about 5 laps each of track 1 and 5 laps of track 2. Combined with the Sample training images, the augmentation of the images with steering angles either < -0.025 or > 0.025 to about 20 times proved to be enough data.
Recovery Image for Track 2 where car was having trouble
The car was having trouble in the following location and hence I provided only these specific recovery images. These are mainly for the car to avoid the long poles on track 2.

Using Keras Image Augmentation Generator
I tried using the Keras Image Augmentation Generator but constantly ran into trouble with it. Keras Image Augmentation generator is a generator which allows about 10 different image augmentation techniques. The one which I really wanted to try out was ZCA whitening. However, for ZCA whitening and std_normalization of the images, the generator had to fit the entire training data which wasn’t possible and keras would constantly run out of memory. So I decided to ditch this method and write my own augmentation methods.
As such, I wanted to keep the augmentation logic simple to the only 3 augmentation methods applied were as follows:
- Changing Brightness Randomly
- Flipping the Center Images for angles != 0
- Adding the Left & Right Images with a 0.25 degree shift.
Change Brightness

Flip Image

Track 1 - Data Distribution
I drove around 5 laps on this track along the straight path and then took a U-turn to drive around in the reverse direction for 5 more laps. The data distribution for this data looked like this looked very similar to the sample training data provided since the road architecture is still the same.

Track 2 - Data Distribution

Track 2 has a much better distribution since this road has a lot of turning angles. Also if it noticed, sharp turns are present which makes the training of car to turn sharper angles easier.
Combined Data Distribution
Finally I combined all these training data into a single dataset to see how the car performed but before I did that I wanted to visualize what that data looked like so that I get a good idea of what biases it has.

Network Selection
After reading a lot of material, I decided to use the Nvidia Model for this behavior training. Comma.ai also has a model which is a good model to be used for this purpose. However, I made a few modifications to the Nvidia model to suit it for this project. I also used a BatchNormalization layer after the Lambda layers. Along with that I also used L2 regularization on the layers which is not used on the nvidia model. The reason for doing this was because early on I found that since the track was relatively straight on track1 and the scenery was relatively similar, overfitting was happening very soon. It was important to keep it down.
Network Architecture & Parameters
The nVidia model consists of 9 layers, including a normalization layer, 5 convolutional Layers and 3 fully connected layers. Although the Nvidia model uses YUV planes for the image, I decided to keep it at RGB to keep the problem simple to begin with.
The convolutional layers in the nvidia model are designed to perform feature extraction and these were designed by nvidia empirically by experimentation by trying out varied layer configurations. The model uses strided convolutions in the first three convolutional layers with 2x2 stride and a 5x5 kernel and a non-strided convolution with a 3x3 kernel size in the last two convolutional layers.

-
Batch Size: I chose the batch size to be 512. I had a lot of training images so to keep training times a little lower I chose a higher batch size. I also experimented with 256, 128, 64 & 32 batch sizes and got higher validation loss.
-
Steps Per Epoch: I kept this to be the size of training data / Batch size.
-
A ‘mean_squared_error’ loss function is used with Adam optimization algorithm configured with a learning rate of 0.0001. This learning rate was selected after bit of trial and error. With larger learning rates (0.1 and 0.001), car was making abrupt steering angle changes, causing bumpy ride.
-
I used the Keras Lambda layers to do Cropping of the image and then the normalization of the image RGB values. This made it easier to not make too much changes to drive.py for doing preprocessing since this was encoded in the model itself. I cropped about 40% from the top since that’s the part which included the sky and trees. However, I think this caused problems on Track 2 when the car was going uphill and some part of the road would get cropped. This is an important point to think about since we can apply cropping reliably in situations where the car is on a flat road.
-
I resized the image to 1/2 its size to (160, 80) from (320, 160) to increase the training size.
Overfitting
One of the biggest problem with this particular project was the overfitting. Within a very few epochs, the network would start overfitting. As I started increased the training data, like combining track 1 with track 2 I noticed that the validation loss kept on increasing. This could be because of the reason that more hidden conv layers might be needed to learn more of the load and the different driving styles.
Layer Visualization
The animated gif’s in this section show the images as the car is driving across the road with the visualization from the last convolution layer from the network before it connects to the Dense Layer. The important thing to notice here are that the images look very similar to the edge detection of the lane lines in this case.
Track 1


Track 1 suffers from overfitting within just 5 epochs. This could be due to the use of more training data than necessary. Also, one way to fix this would be to add different kinds of augmentation techniques. However, the car does manage to run nicely on this track and could run continuously across the laps. I tried about 5 laps and it was still running fine.
Track 2


Similar to track 1, track 2 also suffers from the same problem and the same techniques could be applied to track 2. I tried about 2 laps on track 2. The Track 2’s model was built up with the training data from track 1 + track 2. However, the same model didn’t work on track 1 where the car would inevitably go and crash into the wall on the bridge. On Track 2 also while going uphill the car would sometimes go dangerously close to the edge of the road before managing to recover and come back to the center. This could be due to the cropping problem mentioned above.
Since on track 2 the car’s driving wasn’t very smooth I tried using a Butterworth bandpass filter from scipy but that didn’t give good results. It’s possible that I didn’t choose the right parameters which caused the car to veer of the road when the filter was active.
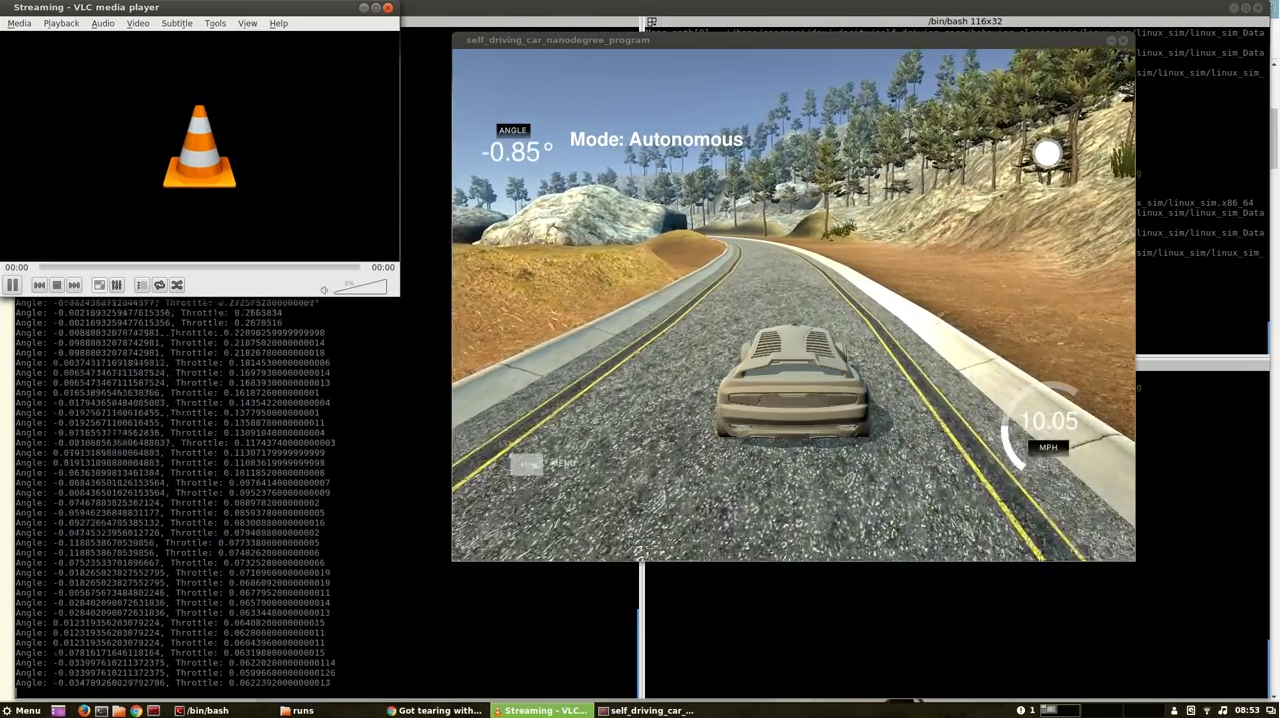
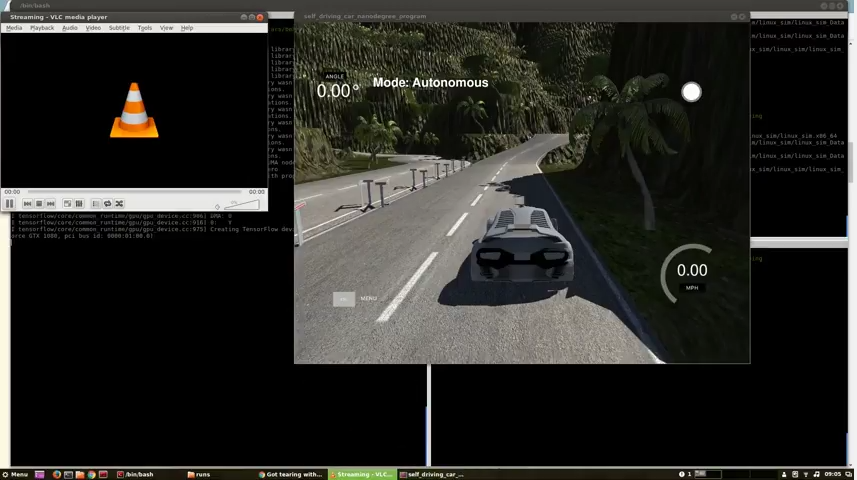
Final Results
Track 1
Track 2
Future Work:
This project is far from being over. Due to time limitations I couldn’t experiment with a custom network as well as the comma.ai network. I definitely want to try out a few things with this.
- How do the pretrained models perform as compared to the nvidia one we have.
- Try with a limited set of training data as well as reduce the resolution of the training data to make the training faster. This was one of my biggest hurdles since even though I was working out of a machine with a GTI1080 yet my training times were ridiculously high.
- How can we generalize the driving and input data so that the car could perform better on track 2.
- Try more augmentation techniques like moving the image from the center. Also, it would be interesting to see if we could images from the 3rd person camera which is shown in the simulator to be used for training instead of the driver view.
This project really pushed the “empirical” experiment based approach of deep learning where it was difficult to theorize under what circumstances the car would drive properly and where it wouldn’t. My belief is that if the training time could be reduced, then it was possible to spend a little more time debugging the behavior of the car.